본 내용은 도서 '이것이 데이터분석이다 With Python'의 내용을 참고했습니다.
https://github.com/yoonkt200/python-data-analysis
탐색적 데이터 분석의 과정
탐색적 데이터 분석은, 데이터의 정보를 파악하며 문제 해결에 필요한 힌트를 분석하는 과정이다. 그 과정은 다음과 같다.
- 데이터의 출처와 주제에 대해 이해한다.
- 데이터의 크기를 알아본다.
- 데이터의 구성 요소를 살펴본다.
- 데이터의 속성을 탐색한다.
- 데이터 간의 상관 관계를 탐색한다.
- 탐색한 데이터를 시각화 한다.
1.2 멕시코풍 프랜차이즈 chipotle의 주문 데이터 분석하기
chipotle 데이터셋의 기초 정보 출력하기
import pandas as pd

# read_csv 함수로 데이터를 Dataframe 형태로 불러옵니다.
file_path = '../data/chipotle.tsv'
chipo = pd.read_csv(file_path, sep = '\t')

print(chipo.shape)
print("------------------------------------")
print(chipo.info())
위의 결과로, order_id, quantity는 수치형 데이터임을 알 수 있고, item_name, choice_description, item_price는 범주형 데이터임을 알 수 있다.
chipotle 데이터셋의 행과 열, 데이터 확인하기
chipo.head(10)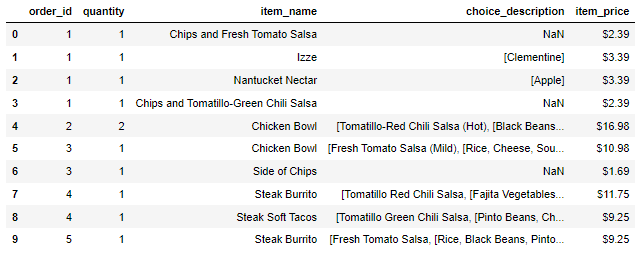
데이터 셋 의미는 다음과 같다.
- order_id : 주문 번호
- quantity : 아이템의 주문 수량
- item_name : 주문한 아이템의 이름
- choice_description : 주문한 아이템의 상세 선택 옵션
- item_price : 주문 아이템의 가격 정보
print(chipo.columns)
print("------------------------------------")
print(chipo.index)
describe() 함수로 기초 통계량 출력하기 - 수치형 데이터
# order_id는 숫자의 의미를 가지지 않기 때문에 str으로 변환합니다.
chipo['order_id'] = chipo['order_id'].astype(str)

# chipo dataframe에서 수치형 피처들의 요약 통계량을 확인합니다.
print(chipo.describe())
unique() 함수로 기초 통계량 출력하기 - 범주형 데이터
# order_id의 개수를 출력합니다.
print(len(chipo['order_id'].unique()))

# item_name의 개수를 출력합니다.
print(len(chipo['item_name'].unique()))
가장 많이 주문한 아이템 top 10 출력하기
# 가장 많이 주문한 item : top 10을 출력합니다.
item_count = chipo['item_name'].value_counts()[:10]
for idx, (val, cnt) in enumerate(item_count.iteritems(), 1):
    print("Top", idx, ":", val, cnt)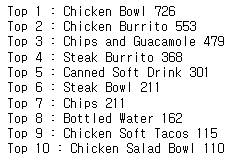
아이템별 주문 개수와 총량 계산하기
# item당 주문 개수를 출력합니다.
order_count = chipo.groupby('item_name')['order_id'].count()
order_count[:10] # item당 주문 개수를 출력합니다.
# item당 주문 총량을 출력합니다.
item_quantity = chipo.groupby('item_name')['quantity'].sum()
item_quantity[:10] # item당 주문 총량을 출력합니다.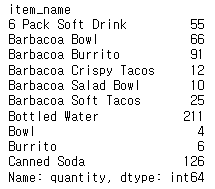
시각화로 분석 결과 살펴보기
%matplotlib inline
import numpy as np
import matplotlib.pyplot as plt

item_name_list = item_quantity.index.tolist()
x_pos = np.arange(len(item_name_list))
order_cnt = item_quantity.values.tolist()

plt.bar(x_pos, order_cnt, align='center')
plt.ylabel('ordered_item_count')
plt.title('Distribution of all orderd item')

plt.show()
item_price는 범주형 데이터이기 때문에, 수치형 특징을 탐색하는데 쓰일 수 없었다. 하지만, 이는 가격이라는 수치를 보여주고 있는 데이터이기 때문에 수치형 데이터로 바꾸어주어서 분석해주어야 할 것이다.
item_price 피처 살펴보기
print(chipo.info())
print('-------------')
chipo['item_price'].head()
apply()와 lambda를 이용해 데이터 전처리하기
# column 단위 데이터에 apply 함수로 전처리를 적용합니다.
chipo['item_price'] = chipo['item_price'].apply(lambda x: float(x[1:]))
chipo.describe()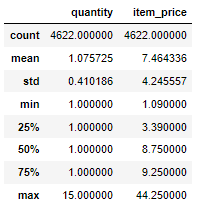
apply() 함수는 시리즈 단위의 연산을 처리하는 기능을 수행하며, sum()이나 mean()과 같이 연산이 정의된 함수를 파라미터로 받는다. 위의 식은 $ 기호를 제거하고 전처리를 한 결과이다.
주문당 평균 계산금액 출력하기
# 주문당 평균 계산금액을 출력합니다.
chipo.groupby('order_id')['item_price'].sum().mean()
한 주문에 10달러 이상 지불한 주문 번호(id) 출력하기
# 한 주문에 10달러 이상 사용한 id를 출력합니다.
chipo_orderid_group = chipo.groupby('order_id').sum()
results = chipo_orderid_group[chipo_orderid_group.item_price >= 10]

print(results[:10])
print(results.index.values)
각 아이템의 가격 구하기
# 각 아이템의 가격을 계산합니다.
chipo_one_item = chipo[chipo.quantity == 1]
price_per_item = chipo_one_item.groupby('item_name').min()
price_per_item.sort_values(by = "item_price", ascending = False)[:10]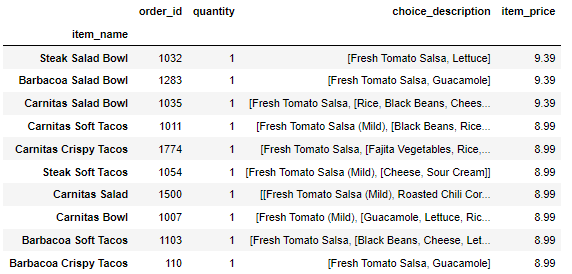
# 아이템 가격 분포 그래프를 출력합니다.
item_name_list = price_per_item.index.tolist()
x_pos = np.arange(len(item_name_list))
item_price = price_per_item['item_price'].tolist()

plt.bar(x_pos, item_price, align='center')
plt.ylabel('item price($)')
plt.title('Distribution of item price')

plt.show()
# 아이템 가격 히스토그램을 출력합니다.
plt.hist(item_price)
plt.ylabel('counts')
plt.title('Histogram of item price')

plt.show()
가장 비싼 주문에서 아이템이 총 몇 개 팔렸는지 구하기
# 가장 비싼 주문에서 item이 총 몇개 팔렸는지를 계산합니다.
chipo.groupby('order_id').sum().sort_values(by='item_price', ascending=False)[:5]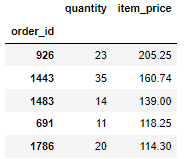
'Veggie Salad Bowl'이 몇 번 주문되었는지 구하기
# “Veggie Salad Bowl”이 몇 번 주문되었는지를 계산합니다.
chipo_salad = chipo[chipo['item_name'] == "Veggie Salad Bowl"]

# 한 주문 내에서 중복 집계된 item_name을 제거합니다.
chipo_salad = chipo_salad.drop_duplicates(['item_name', 'order_id'])

print(len(chipo_salad))
chipo_salad.head(5)
'Chicken Bowl'을 2개 이상 주문한 주문 횟수 구하기
# “Chicken Bowl”을 2개 이상 주문한 주문 횟수를 구합니다.
chipo_chicken = chipo[chipo['item_name'] == "Chicken Bowl"]
chipo_chicken_result = chipo_chicken[chipo_chicken['quantity'] >= 2]
print(chipo_chicken_result.shape[0])
# “Chicken Bowl”을 2개 이상 주문한 고객들의 "Chicken Bowl" 메뉴의 총 주문 수량을 구합니다.
chipo_chicken = chipo[chipo['item_name'] == "Chicken Bowl"]
chipo_chicken_ordersum = chipo_chicken.groupby('order_id').sum()['quantity']
chipo_chicken_result = chipo_chicken_ordersum[chipo_chicken_ordersum >= 2]

print(len(chipo_chicken_result))
chipo_chicken_result.head(5)
'데이터 분석 > 이것이 데이터 분석이다 with python' 카테고리의 다른 글
| 기본 데이터 분석 (0) | 2022.07.27 |
|---|